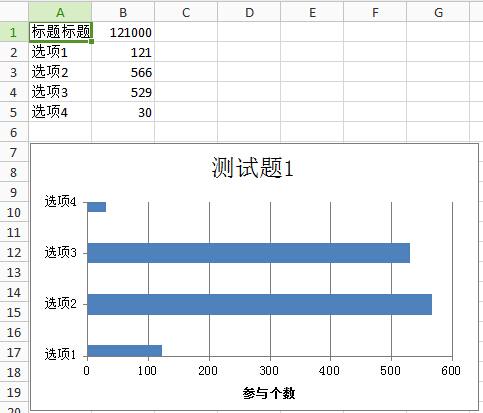
error_reporting(E_ALL);
ini_set('display_errors', TRUE);
ini_set('display_startup_errors', TRUE);
if (PHP_SAPI == 'cli') die('This example should only be run from a Web Browser');
import('ORG.phpexcel.PHPExcel', '', '.php');
import('ORG.phpexcel.PHPExcel.IOFactory', '', '.php');
import('ORG.phpexcel.PHPExcel.Chart.Title', '', '.php');
//////////////////////////////////////
$objPHPExcel = new PHPExcel();
$objWorksheet = $objPHPExcel->getActiveSheet();
$objWorksheet->fromArray(
array(
array('标题标题标题标题', 121000),
array('选项1', 121),
array('选项2', 566),
array('选项3', 529),
array('选项4', 30),
)
);
$objWorksheet->setTitle("Q2"); //给当前sheet设置名称
$dataseriesLabels = array(
new PHPExcel_Chart_DataSeriesValues('String', 'Worksheet!$B$1', NULL, 1),//2010
//new PHPExcel_Chart_DataSeriesValues('String', 'Worksheet!$C$1', NULL, 1),//2011
//new PHPExcel_Chart_DataSeriesValues('String', 'Worksheet!$D$1', NULL, 1),//2012
);
$xAxisTickValues = array(
new PHPExcel_Chart_DataSeriesValues('String', 'Worksheet!$A$2:$A$5', NULL, 4),//Q1 to Q4
);
$dataSeriesValues = array(
new PHPExcel_Chart_DataSeriesValues('Number', 'Worksheet!$B$2:$B$5', NULL, 4),
//new PHPExcel_Chart_DataSeriesValues('Number', 'Worksheet!$C$2:$C$5', NULL, 4),
//new PHPExcel_Chart_DataSeriesValues('Number', 'Worksheet!$D$2:$D$5', NULL, 4),
);
//Build the dataseries
$series = new PHPExcel_Chart_DataSeries(
PHPExcel_Chart_DataSeries::TYPE_BARCHART,// plotType
PHPExcel_Chart_DataSeries::GROUPING_CLUSTERED,// plotGrouping
range(0, count($dataSeriesValues)-1),// plotOrder
$dataseriesLabels,// plotLabel
$xAxisTickValues,// plotCategory
$dataSeriesValues// plotValues
);
//Set additional dataseries parameters
//Make it a horizontal bar rather than a vertical column graph
$series->setPlotDirection(PHPExcel_Chart_DataSeries::DIRECTION_BAR);
//Set the series in the plot area
$plotarea = new PHPExcel_Chart_PlotArea(NULL, array($series));
//Set the chart legend
//$legend = new PHPExcel_Chart_Legend(PHPExcel_Chart_Legend::POSITION_RIGHT, NULL, false);
$legend = NULL;
$title = new PHPExcel_Chart_Title('测试题1');
$yAxisLabel = new PHPExcel_Chart_Title('参与人数');
//Create the chart
$chart = new PHPExcel_Chart(
'chart1',// name
$title,// title
$legend,// legend
$plotarea,// plotArea
true,// plotVisibleOnly
0,// displayBlanksAs
NULL,// xAxisLabel
$yAxisLabel// yAxisLabel
);
//Set the position where the chart should appear in the worksheet
$chart->setTopLeftPosition('A7');
$chart->setBottomRightPosition('H20');
//Add the chart to the worksheet
$objWorksheet->addChart($chart);
//////////////////////////////////////////////////////////////////////////////////////
// Set active sheet index to the first sheet, so Excel opens this as the first sheet
$objPHPExcel->setActiveSheetIndex(0);
$objWriter = PHPExcel_IOFactory::createWriter($objPHPExcel, 'Excel2007');
$objWriter->setIncludeCharts(TRUE);
$filename = '明细表_'.date("Y_m_d").".xlsx";
// Redirect output to a client’s web browser (Excel2007)
//header('Content-Type: application/vnd.openxmlformats-officedocument.spreadsheetml.sheet');
//
//////////////////////////////////////////
//处理中文文件名乱码问题
$ua = $_SERVER["HTTP_USER_AGENT"];
$encoded_filename = urlencode($filename);
$encoded_filename = str_replace("+", "%20",$encoded_filename);
header('Content-Type: application/octet-stream');
if (preg_match("/MSIE/", $ua)) {
$filename = $encoded_filename;
header('Content-Disposition: attachment;filename="' .$filename . '"');
}else if (preg_match("/Firefox/", $ua)){
header('Content-Disposition: attachment; filename*="utf8\'\'' . $filename . '"');
}else {
header('Content-Disposition: attachment; filename="' . $filename . '"');
}
////////////////////////////////////////
header('Cache-Control: max-age=0');
// If you're serving to IE 9, then the following may be needed
header('Cache-Control: max-age=1');
// If you're serving to IE over SSL, then the following may be needed
header ('Expires: Mon, 26 Jul 1997 05:00:00 GMT'); // Date in the past
header ('Last-Modified: '.gmdate('D, d M Y H:i:s').' GMT'); // always modified
header ('Cache-Control: cache, must-revalidate'); // HTTP/1.1
header ('Pragma: public'); // HTTP/1.0
$objWriter->save('php://output');
exit;
红色的数据部分,多加几列就变成多柱状图,并且后面红色部分也要相应的变更。
其它相关链接:
http://blog.csdn.net/qq_20480611/article/details/47982501
http://blog.csdn.net/qq_20480611/article/details/48000007
http://blog.csdn.net/xcl168/article/details/25001205
http://www.cnblogs.com/phpgcs/p/phpexcel_chart_2.html?utm_source=tuicool&utm_medium=referral
http://blog.csdn.net/ouyangyiqin/article/details/8901038
http://www.tuicool.com/articles/vA7VJj
|